Candlestick charts are widely used in technical analysis of equity and currency price patterns. These are generally used by traders to determine possible price movements based on past patterns. These are used to determine when to enter and exit markets. Candlesticks originated in Japan in 1800s. These are thought to be developed by Munehisa Homma, a Japanese rice trader.

Parts of a Candlestick
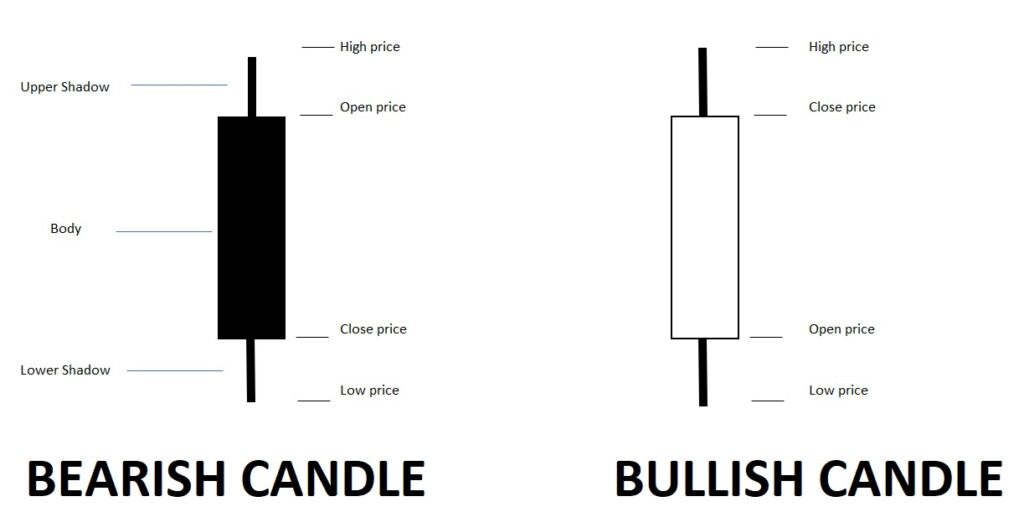
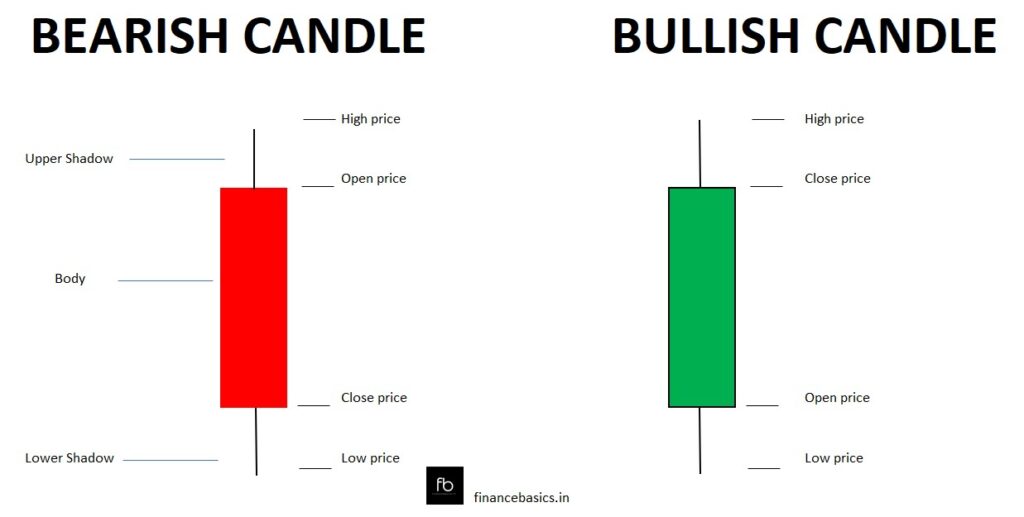
A candlestick shows the market’s open, high, low, and close prices for the day. It is divided into three different parts. The wide part of the candlestick is called the ‘real body’. The real body represents the price range between the open and close of that day’s trading.
- Upper Shadow – The highest price of a stock during a given period is reflected by the ‘upper shadow’. It is also called ‘upper wick’.
- Real Body – The wide part of the candlestick is called the ‘real body’. It represents the price range between the opening and closing price. When the real body is black or red, it means the closing price was lower than the opening price. If the real body is white or green, it means the closing price was higher than the opening price.
- Lower Shadow – The lowest traded price of a stock during a given period is reflected by the ‘lower shadow’. It is also called ‘lower wick’.

Reading a Candlestick
Any candlestick displays the below mentioned four data points.
- Open – It is the opening price of a stock when trading begins.
- High – The highest price for the stock is reflected by a chart’s ‘upper shadow’. If the opening price was also its highest price during trading, the ‘upper shadow’ will be absent.
- Low: The lowest price for the stock during trading hours is reflected by a chart’s ‘lower shadow’. If its opening price was also its lowest price then the ‘lower shadow’ will be absent in the candle chart.
- Close: It is the closing price at which the stock traded last at the end of a given period.
The price range is the distance from the top of the upper shadow to the bottom of the lower shadow during the period captured by the candlestick. A green candlestick indicates buying trend. It points towards a bullish movement. A red candlestick indicates a selling trend. Red candlestick points towards a bearish movement. There are 42 recognized candlestick patterns.


