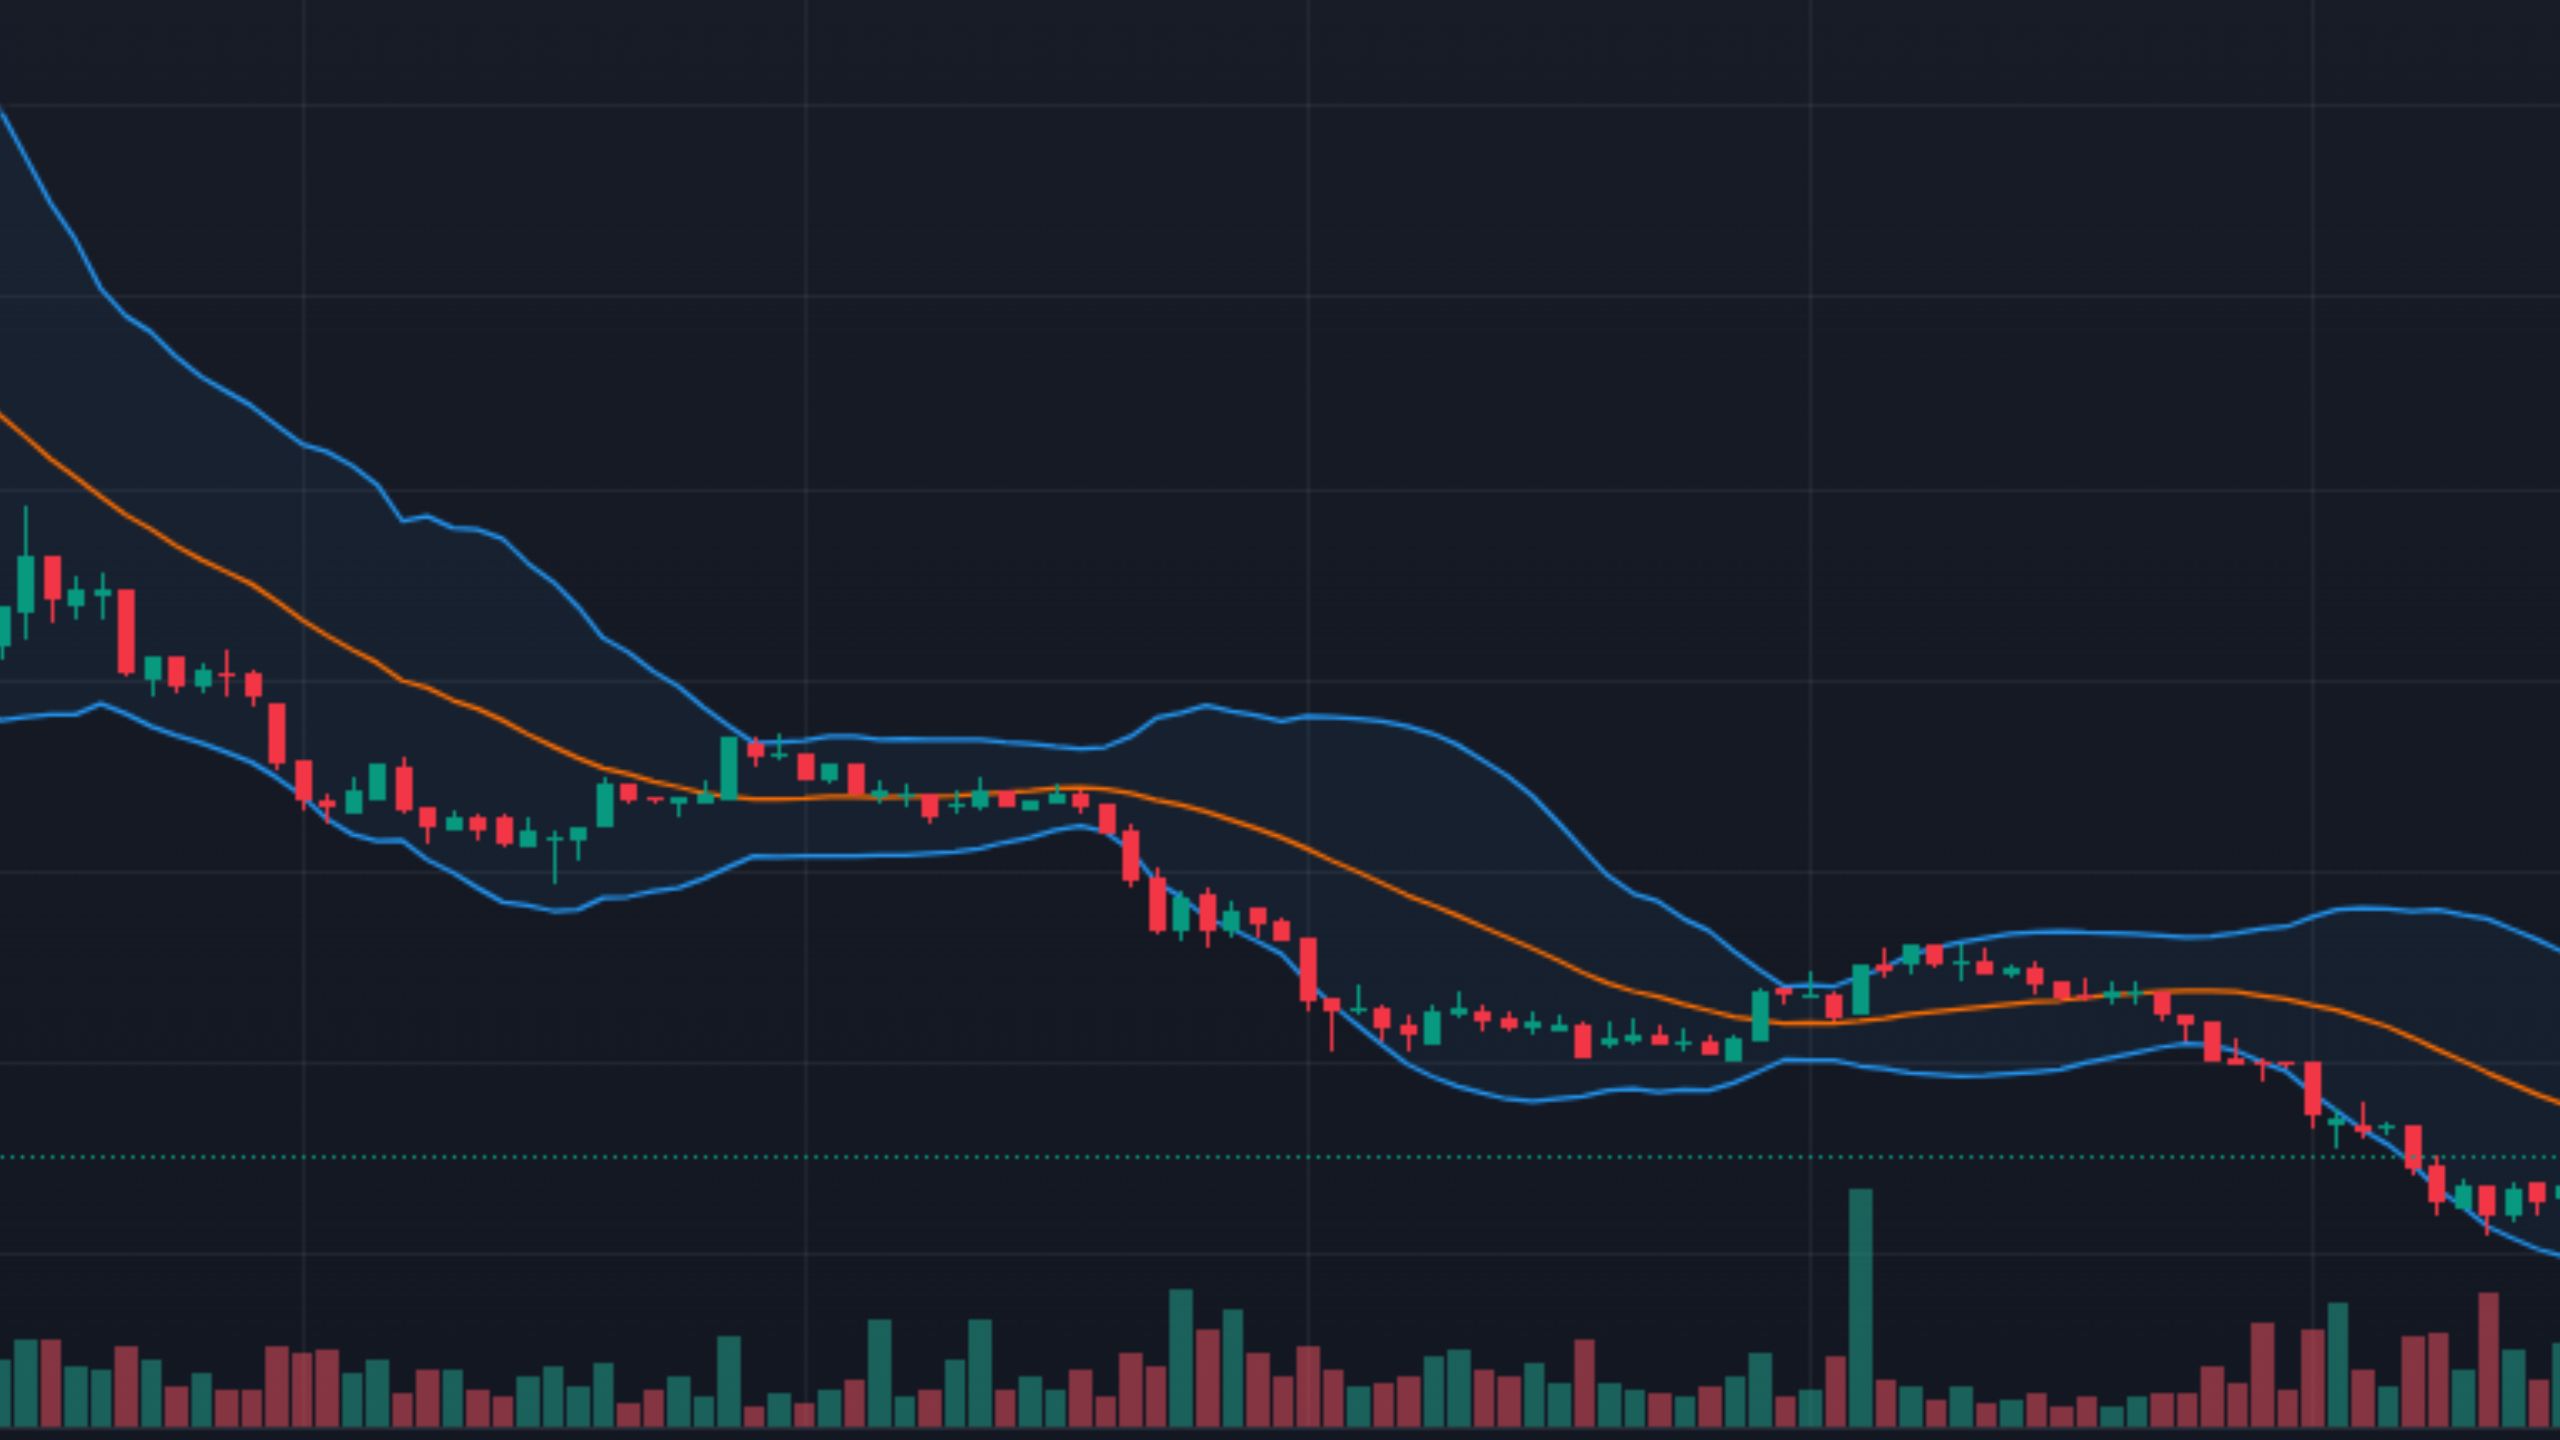
Bollinger bands are a popular technical stock analysis tool. These were developed by John Bollinger in the 1980s. Bollinger bands are plotted as two standard deviations, positive and negative from a simple moving average (SMA) of a security’s price. These help to identify price movements and potential entry and exit points. They help traders evaluate stock price action and stock volatility. Since Bollinger Bands use two sets of standard deviation around a SMA, generally the observed price action falls within these bands around 90% of the times.
Components of Bollinger Bands
- A Bollinger Band consists of a middle band (which is a moving average) and an upper and lower band.
- The upper and lower bands are set above and below the moving average by a certain number of standard deviations of price. This helps to factor in volatility.
- Bollinger Bands generally use a 20-period moving average. The ‘period’ could be 5 minutes, an hour or a day.
- The number of periods in the moving average and the number of deviations can be customized.
- When the prices move close to the upper band, it indicates that the stock/asset is overbought.
- If the prices moves close to the lower band, it indicates that the stock/asset is oversold and the stock price may now increase.
Calculation of Bollinger Bands
Bollinger bands are calculated using the below formula:
- Middle Band = 20-day simple moving average (SMA)
- Upper Band = 20-day SMA + (20-day standard deviation of price x 2)
- Lower Band = 20-day SMA – (20-day standard deviation of price x 2)
Limitations of Bollinger Bands
- Bollinger bands are reactive, not predictive. The bands react to changes in price movements but do not predict future prices.
- They cannot be used as the only tool for making price predictions. John Bollinger, the developer of Bollinger bands recommends using bands with other related tools that provide more direct market signals.
- The effectiveness of Bollinger bands varies from market to market. The standard settings of simple moving averages and standard deviations will not always work and traders may need to adjust these and monitor them.
Bollinger bands are a great technical analysis tool to identify potential trends, reversals and breakouts. However traders should also use other technical indicators along with Bollinger bands to arrive at a decision.


